- Projects
- Insights
-
Careers

Careers
Ranked a Top Workplace and ENR Top 500 Design Firm, Burns offers opportunities to inspire, create and deliver transformational projects that last generations.
- News + Events
-
About

About
Burns inspires, creates and delivers specialized-engineering solutions for mission-critical facilities.
- Offices
-
What We Do
Discipline
Expertise
Industry-Specific - Projects
- Insights
- Careers
- News + Events
- About
- Offices
"*" indicates required fields
Taking the Reins: Are On-Site Power Solutions a Cost-Effective Choice for Today’s Data Centers?
As the global demand for data continues to surge, so does the demand for powering these critical facilities. For many clients, deploying a large-scale data center is driven by the utility company’s ability to provide electrical energy (either for prime power or for standby) and the lead time for electrical equipment. The options available to data center owners are vast, and providing decision makers with actionable insights that support confident, cost-effective power design choices is necessary. This article presents a comparative study of key power supply options available to data center owners. Ultimately, we aim to determine whether owners should take matters into their own hands and pursue on-site power solutions, and if so, which path provides the best economic value and lowest carbon impact.
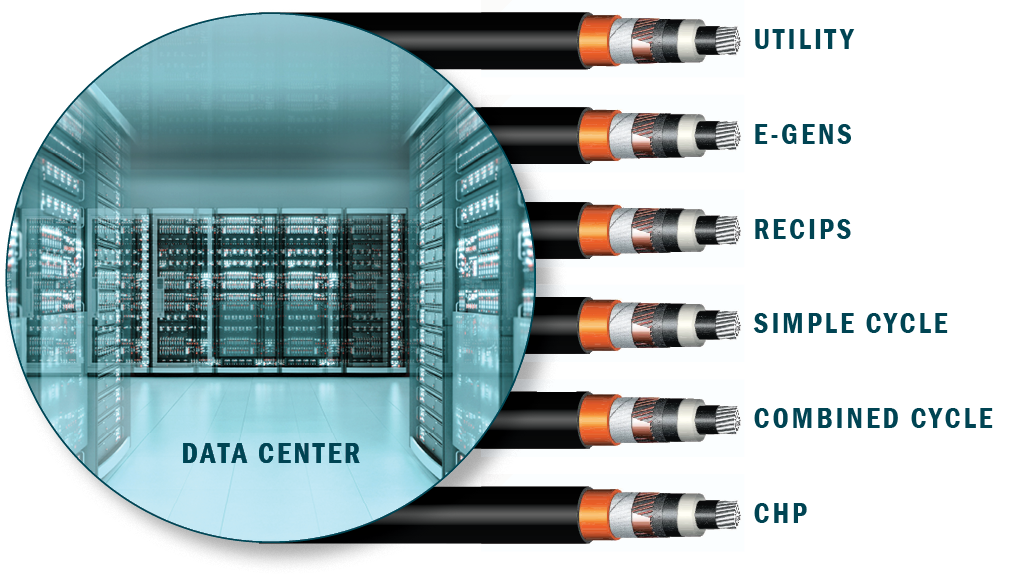
Our team reviewed six options for supplying a 100MW data center block in the state of Virginia1 2 with a blended cost of utility-supplied electricity of $0.10/kWh3 and a natural gas cost of $4.30/MMBTU4 that could be reasonably scaled to any size considered by the client:
| Option5 | Description6 | Redundancy7 |
|---|---|---|
| 1 | Utility grid-supplied electricity with backup diesel generators | 2N |
| 2 | Utility grid-supplied electricity with large scale reciprocating engine generators used only for backup | 2N |
| 3 | Baseload large scale reciprocating engine generators with utility supply as the backup, no diesel generators. | 2N |
| 4 | Baseload simple cycle gas turbine generators with utility backup, 25% backup with diesel emergency generators | 2.25N |
| 5 | Baseload combined cycle (gas turbines with steam turbines), utility supply as backup, and 25% backup with diesel generators | 2.25N |
| 6 | Baseload combined cycle (gas turbines with steam turbines) in a Combined Heat and Power (CHP) application, utility supply as backup, and 25% backup with diesel generators – assumes co-located with a thermal host that can use the waste heat | 2.25N |
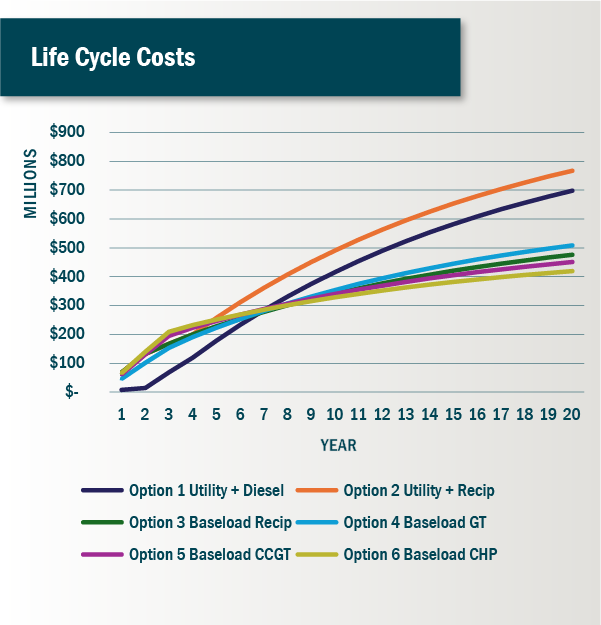
Each option has progressively higher capital costs. These costs were normalized in the analysis for comparative purposes. However, each option also has varied efficiency. Producing power closest to the load reduces losses, and cycle optimization through reduction in wasted thermal energy increases efficiency.
As shown in the chart below, Option 1, the utility supply option, has the lowest first costs but due to the higher operating costs associated with the utility-supplied electrical energy, it has lower ROI over the life cycle. It’s easy to see that the increase in efficiency afforded by on-site generation and progressively more efficient solutions overcome the increased capital burden and provide the lowest life cycle costs. Option 6 – CHP, is the winning solution over the life cycle.
While efficiency and carbon accounting are important considerations in developing modern data centers, the artificial intelligence arms race is driving very high opportunity costs. A delay in deploying a 100MW AI asset could lead to $40 million per month or more lost revenue and profit. The larger, more complex and efficient options take longer to deploy. It’s important to understand and consider the time to deploy the various options, particularly in the current supply chain environment. With supply chain limitations and concerns about timelines for utility interconnection and securing a Title V air permit, understanding the speed to market is difficult.
Due to greater availability of reciprocating engines versus gas turbines currently, Options 2 and 3 are the fastest to market. In our model, we considered a scenario where Options 4, 5, and 6 could be operational one year in advance of Option 1 and where Option 3 could be operational two years in advance of Option 1. When the opportunity costs are layered into this evaluation (valued as a credit in the analyses), the speed to market becomes a dominant driver.
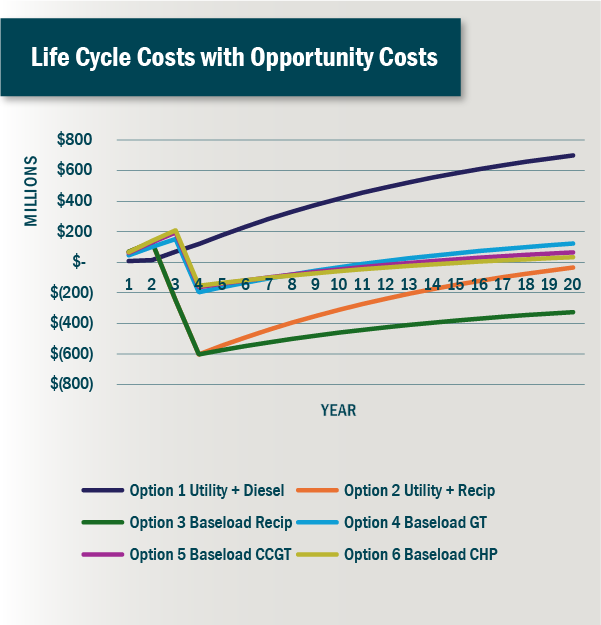
The takeaway from this analysis is that a higher initial investment in a more efficient solution generally has positive long-term implications, but speed to market in the current environment dominates the economics, making Option 3 the clear winner under these assumptions.
We also considered the carbon impacts of these various options for this theoretical data center. For the same amount of MWh consumed per year, the resulting total carbon emissions vary dramatically as shown in the chart below. While the on-site carbon may be dramatically higher, the total carbon of each option reflects the impacts of sourced electricity based on the makeup of the localized grid. This chart considers the carbon associated with the electrons consumed at the data center based on the source, it does not consider renewable energy credits or other offsite carbon solutions – reflecting the true carbon cost of a given installation.
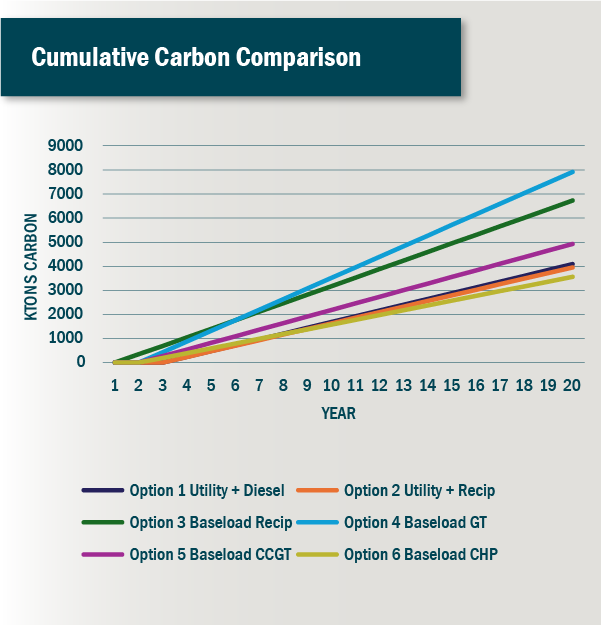
Like the financial analysis, the carbon impacts of each option directly correlate to overall system efficiency. Investment in a more efficient system can dramatically reduce the total carbon footprint of a facility over its life cycle. If remote renewable credits are planned to be used as offsets, the hurdle for these offsets is much lower when the system is designed for efficiency.
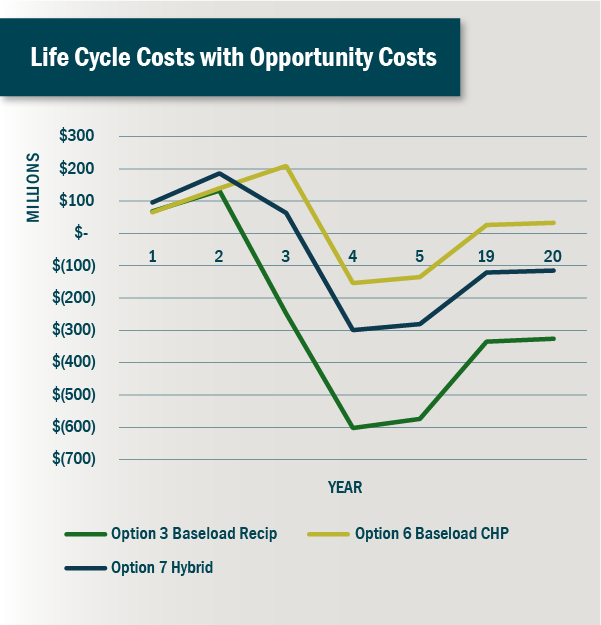
Driven largely by speed to market, many data center developers prefer investments with a relatively short economic horizon. Some developers recognize that while data center technology and application may change rapidly over a 3–5-year horizon, the power infrastructure for these data centers and the requirements for uptime and resilience are not bound by those same constraints. The data center will exist for decades, even if the use case changes. Power infrastructure decisions based on longer horizons provide a stable solution for years to come, reducing the total outlay and carbon footprint over time. While there are hundreds if not thousands of possible permutations that could be considered, a hybrid solution, illustrated below, that deploys reciprocating engines early to populate a data center while constructing the larger combined cycle or CHP power plant, might provide the best of all solutions – blending a faster time to market with long term efficiency and cost reductions over the life cycle. Each of these permutations would have varied CAPEX (Capital Expenditures) and OPEX (Operating Expenditures) based on efficiency and time to market. The initial results indicate that over the 20-year study period the hybrid solution is unable to overcome the increased expenditure to provide a return on investment economically, but it would have a profoundly different cumulative carbon profile.
| Option | Description | Redundancy |
|---|---|---|
| 7 - Hybrid | 50% Baseload reciprocating generators complete at year two with100% baseload combined cycle (gas turbines with steam turbines) in a Combined Heat and Power (CHP) application, utility supply as backup. Does not include diesel generators backup – assumes co-located with a thermal host that can use the waste heat | 2.5N8 |
This study has made it clear that speed to market is king. However, properly considering the infrastructure design can have profound implications on the total value stack over the life cycle of the data center. Burns’ Power & Utilities team specializes in on-site power solutions for mission-critical facilities and stands ready to rigorously assess data center strategies, challenging key assumptions and unlocking opportunities across our client’s portfolios.
____________________
1 Home to the largest sample of data center clusters in the United States
2 Results in other locations would vary based on the relative costs of electricity from the utility, the cost of natural gas, and the relative carbon intensities of the regional electrical grid.
3 Energy and demand changes are based on current tariffs published by First Energy in the Dominion Energy territory (Tariff “K”.1N). Tariffs from other utilities and in other regions would have different impacts.
4 Based on the Henry Hub price at the time
5 Analysis does not consider electric market participation of on-site generation which could dramatically increase the value of these assets.
6 Additional assumptions used in the analyses:
- Electric utility charges assume 1N, no redundancy
- Diesel fuel priced at $3 per US gallon
- Discount rate used was 7.5%
- Evaluation horizon was 20 years, including construction
- CO2 emissions:
- Grid supply 594 lb/MWh
- Diesel supply 2670 lb/MWh
- Gas (35% efficient supply) 1141 lb/MWh
- Operating revenue of AI DC assumed at $40M / month
72N assumes fully backed up supply by either diesel of natural gas reciprocating engines. 2.25N assumes diesel backup of 25% of the site load by emergency diesels in addition to the utility and on-site generation
8 Additional redundancy at full buildout resulting from full CHP generation, full utility backup, plus 50% reciprocating generators. This analysis could be further optimized with the use of temporary trailer mounted reciprocating engines that could be used as bridge power for future data center deployments.